Integration Problems
Slack integration not working
See here
Check if data is flowing
Check Log injection with Browser
Go to DemoUI
Select tab
SystemSelect
Flink ConnectorsClick on
ELKInception3You should see values go up under
Records Sentwhen launching incident creation
Check Log injection with CommandLine
To check if logs are being injected through the demo script:
Launch
./tools/22_monitor_kafka.shSelect option 5
You should see data coming in.
Check Events injection with CommandLine
To check if events are being injected through the demo script:
Launch
./tools/22_monitor_kafka.sh
- Select option 4
You should see data coming in.
Check Alerts and/or Stories being generated with CommandLine
To check if stories are being generated:
Launch
./tools/22_monitor_kafka.shSelect option 2 or 3
You should see data being generated.
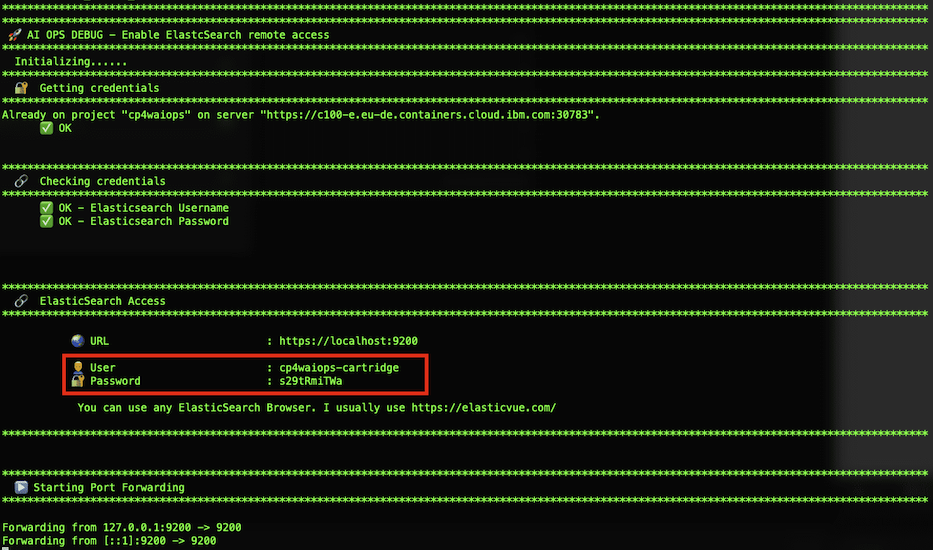
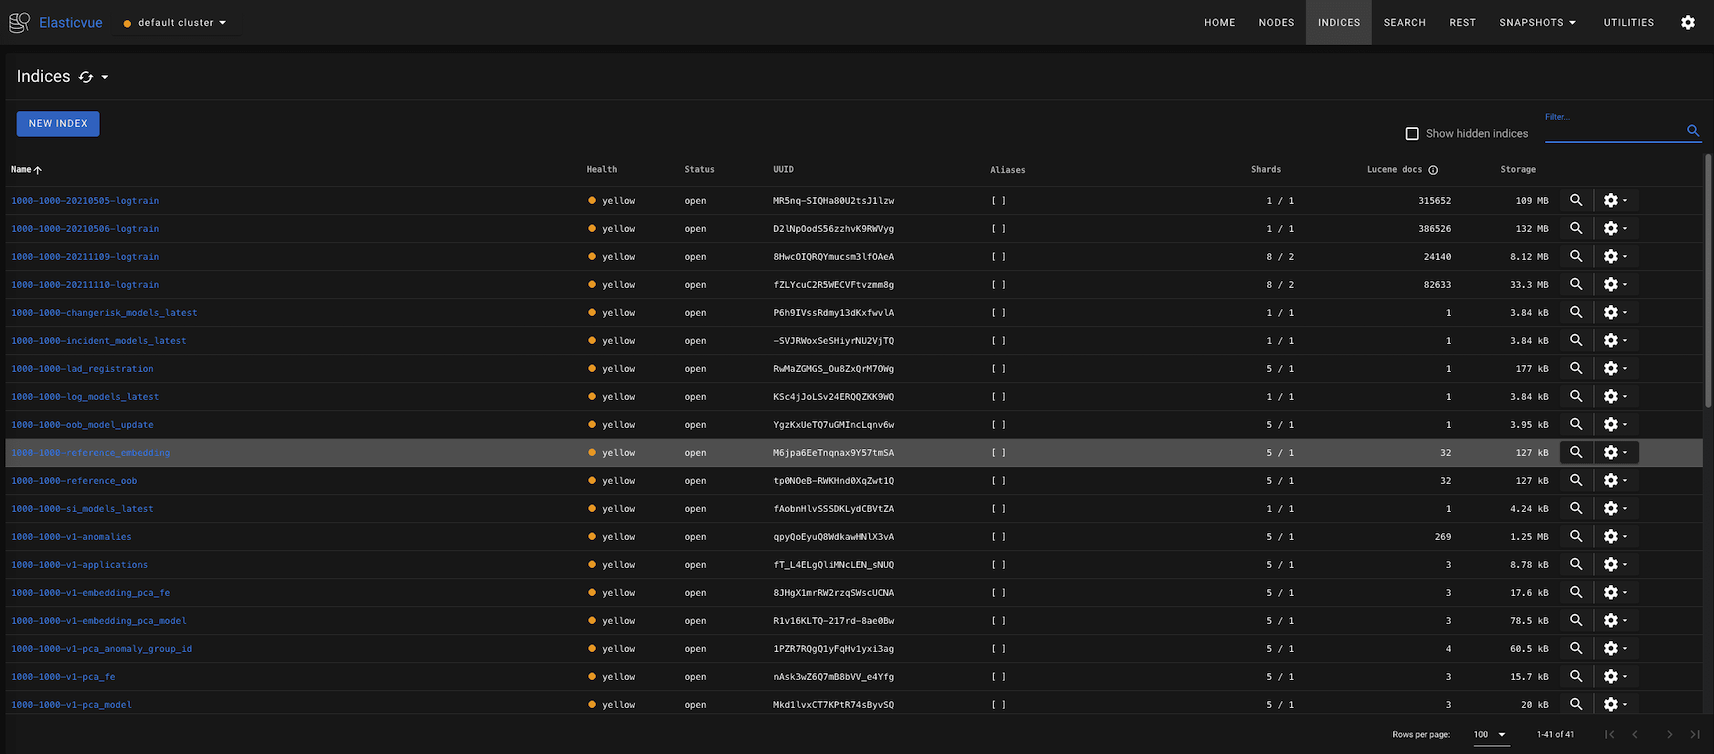
Monitor ElasticSearch Indexes with Browser
Run ./tools/28_access_elastic.sh in a separate terminal window.
This allows you to access ElasticSearch and gives you:
ES User
ES Password
Monitor ElasticSearch Indexes from Firefox
I use the Elasticvue Firefox plugin.
Follow these steps to connects from Elasticvue:
Select
Add Cluster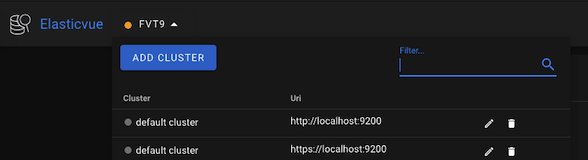
Put in the credentials and make sure you put
httpsand nothttpin the URL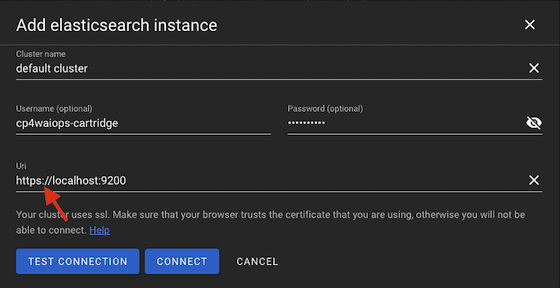
Click
Test Connection- you will get an errorClick on the
https://localhost:9200URL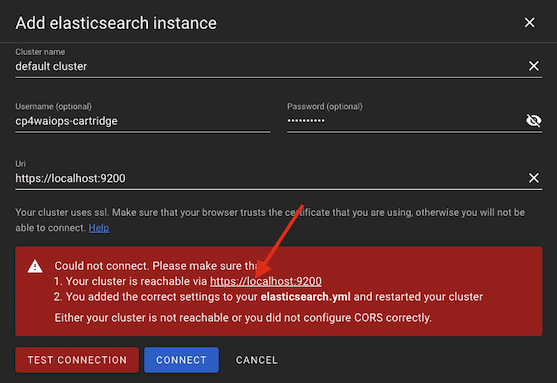
This will open a new Tab, select
Accept Risk and Continue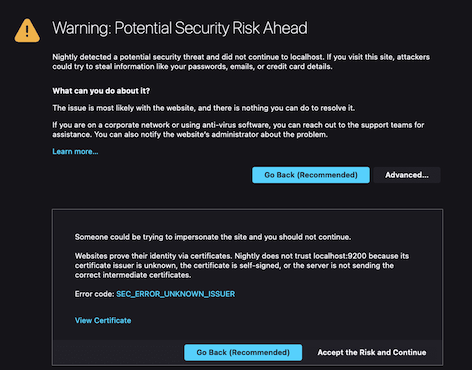
Cancel the login screen and go back to the previous tab
Click
ConnectYou should now be connected to your CP4AIOPS ElasticSearch instance
Check ElasticSearch Indexes with CommandLine
Run
./tools/28_access_elastic.shin a separate terminal window.
This allows you to access ElasticSearch.
Launch
./tools/23_monitor_es.shSelect option 5
You should see data coming in.