Understand the Incident
📥 STEP: Understand the Incident
🚀 Action Click twice on the Last occurence Header.
Result: The “Commit in repository robot-shop by Niklaus Hirt on file robot-shop.yaml” should be at the bottom*

📣 Narration
When trying to understand what happened during the incident, I sort the Alerts by occurence. This allows you to understand the chain of events.
- I can see that the first event was a code change that had been commited to GitHub. When I hover over the description I get the full text. So it seems that the Development Team has reduced the available memory for the mysql database.
Other events are confirming the hypothesis.
- I can then see the CI/CD process kick in and deploys the code change to the system detected by the Security tool and
- Instana has has detected the memory size change.
- Then Functional Selenium Tests start failing and
- Turbonomic tries to scale-up the mysql database.
- Instana tells me that the mysql Pod is not running anymore, the replicas are not matching the desired state.
- CloudPak for AIOps has learned the normal, good patterns for logs coming from the applications. The Story contains a Log Anomaly that has been detected in the ratings service that cannot acces the mysql database.
📥 STEP: Metric Anomaly
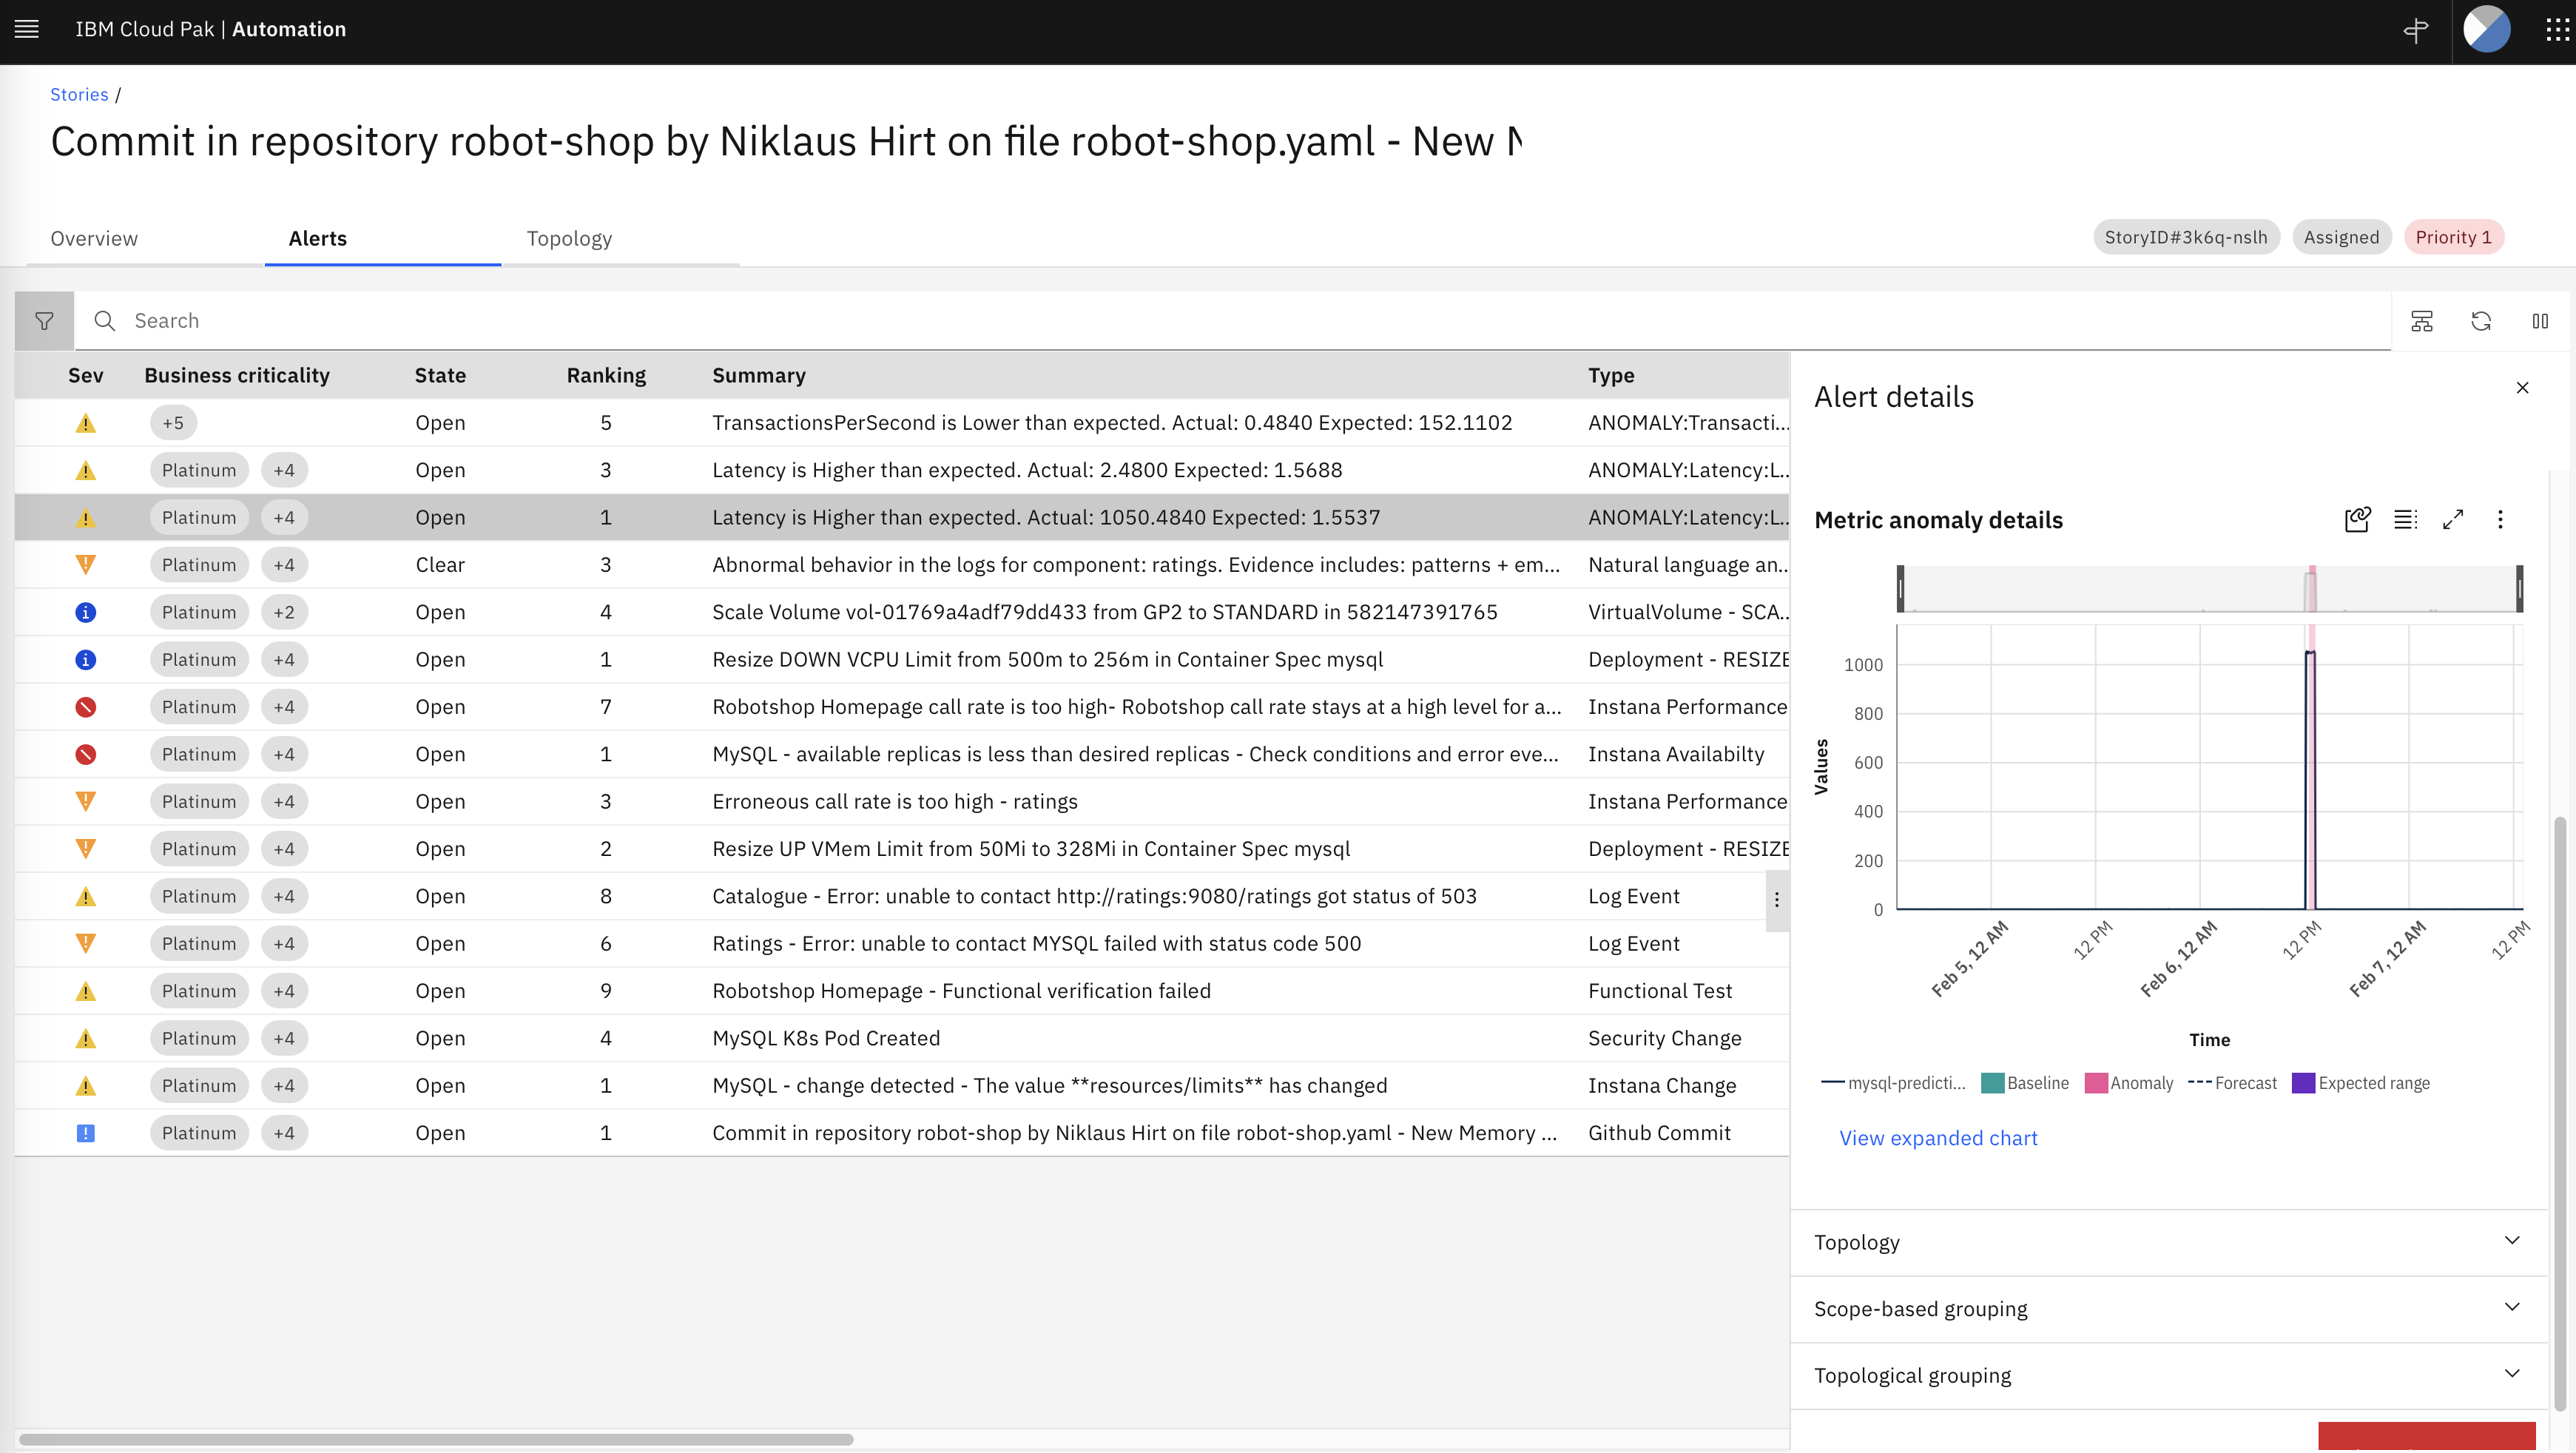
🚀 Action Click on a Alert line that has ANOMALY: in the Type column. Then open the Metric Anomaly Details accordion.
📣 Narration
- CloudPak for AIOps is also capable of collecting metrics from multiple sources and detecting Metric Anomalies. It was trained on hundreds or thousands of metrics from the environment and constructs a dynamic baseline (shown in green). The graphic suddenly turns red which relates to detected anomaly when the database is consuming a higher amount of memory than usual.
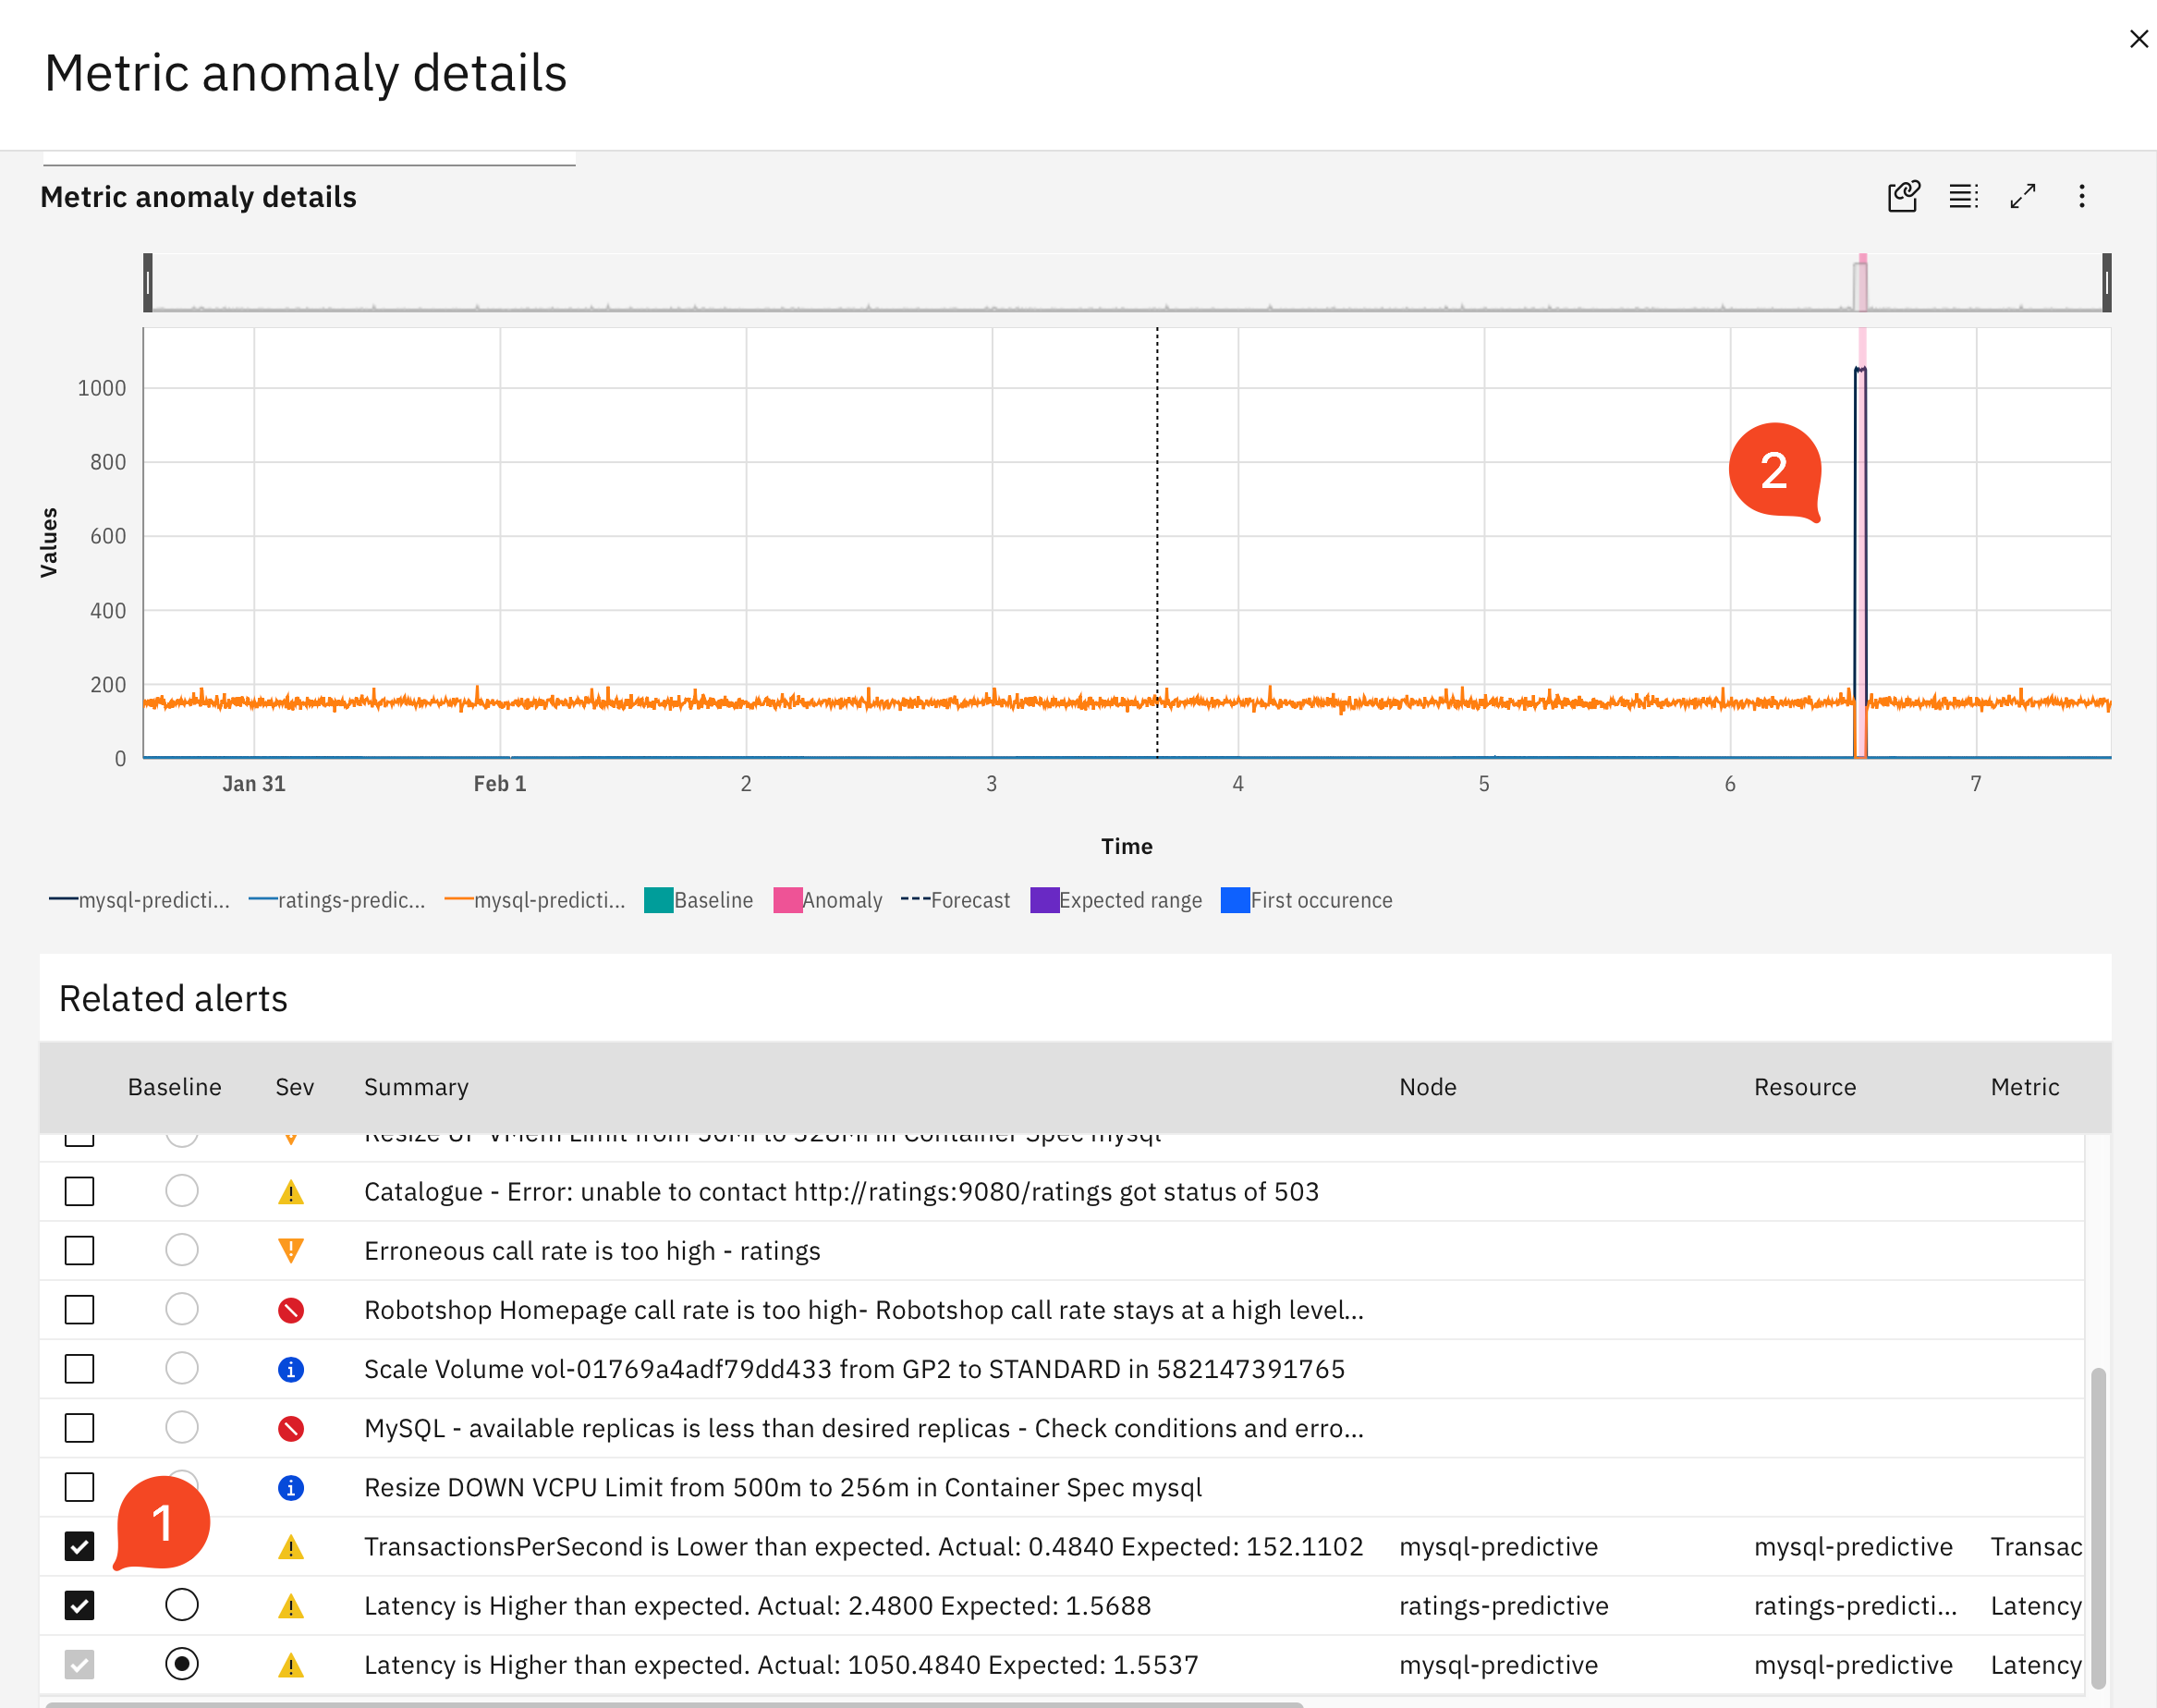
🚀 Action (1) In Related Alerts select some additional alerts.
📣 Narration
You can display several alerts at the same time to better understand the temporal dependencies
🚀 Action (2) Select a portion of the graph with your mouse to zoom in
📣 Narration
Now let’s zoom in to better see the anomalies
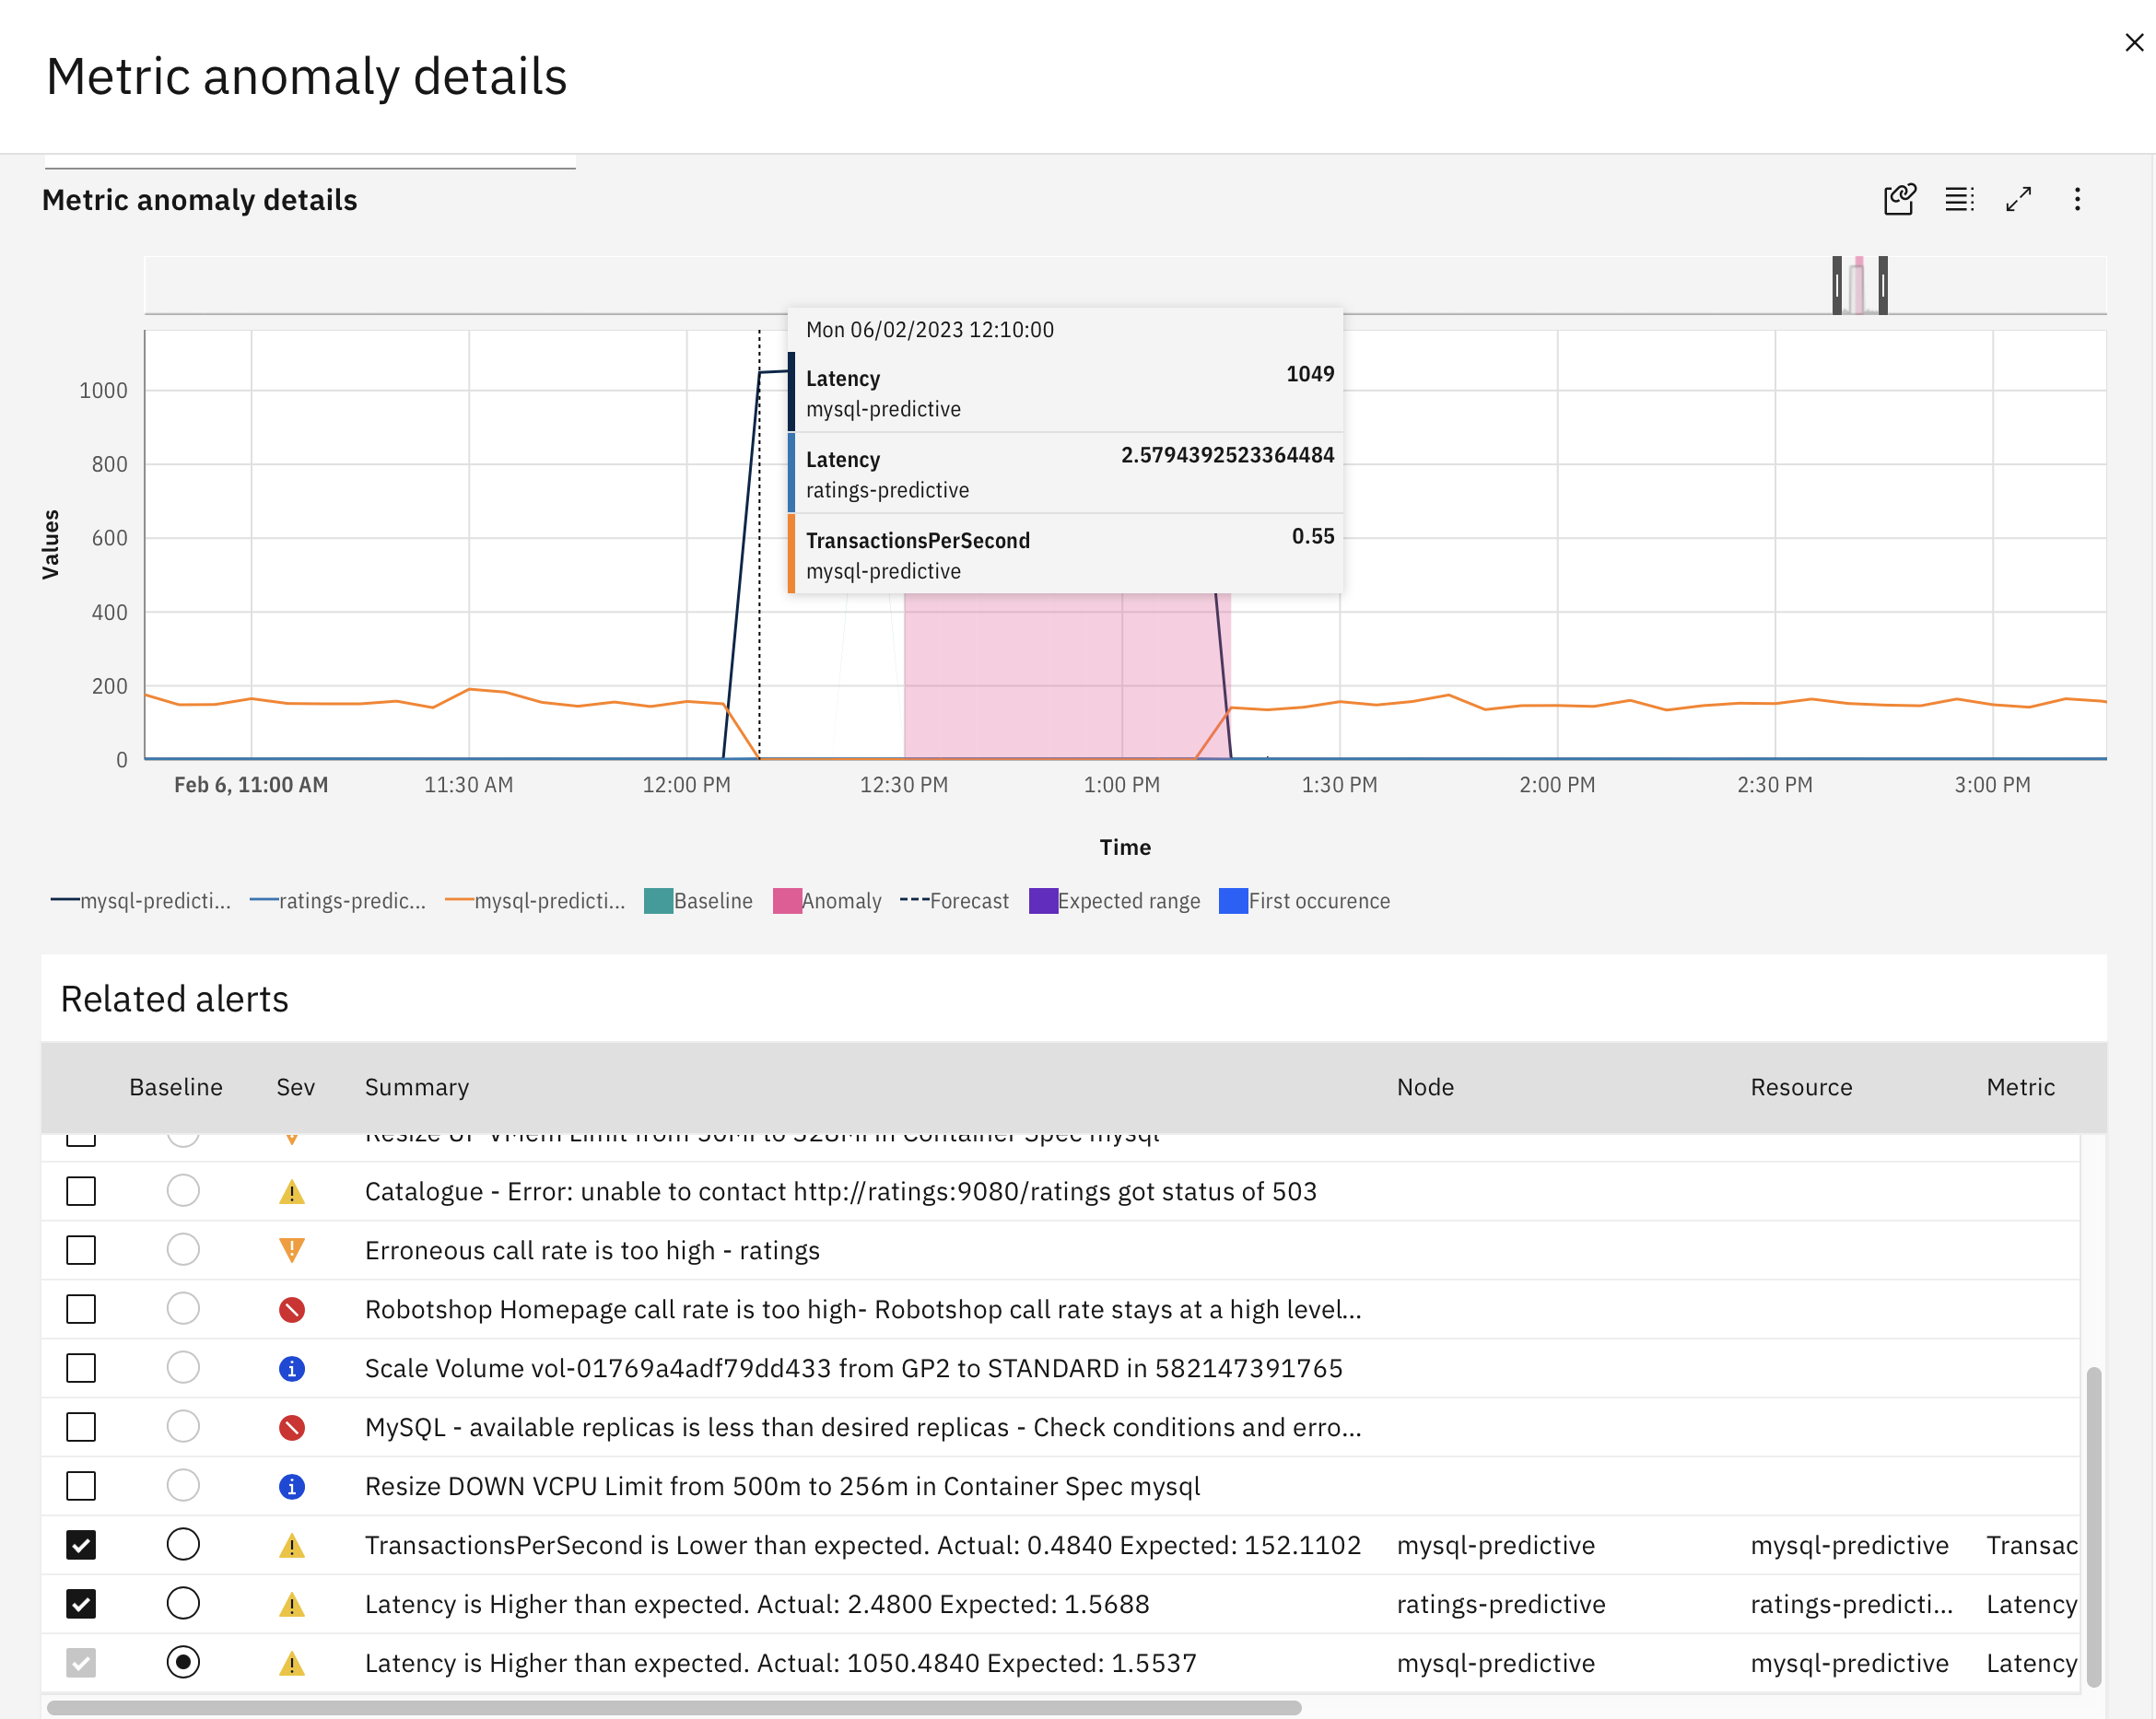
🚀 Action Hover over a datapoint to show the before/after values.
📣 Narration
I can clearly see that the incident caused the Latencies to skyrocket and the Transactions per Seconds are almost zero. This is yet another confirmation of the source of the problem.
🚀 Action Close the Metric anomaly details view.