Examine the Alerts
📥 STEP: Examine the Alerts
🚀 Action Close the ServiceNow page and click the Alerts Tab.

📣 Narration
Notice, that alerts are not sorted by severity, but the AI engine ranked them by relevance. The ones that are likely related to the root cause are at the top. Let’s look at the first row for some more details.
🚀 Action Click on the first Alert in the list.
📣 Narration
In the Alert details, you can see different types of groupings explaining why the specific alert was added to the story.
📥 STEP: Scope based grouping
🚀 Action Click Scope-based grouping.
📣 Narration
Some alerts were added to the story because they occurred on the same resource within a short period (default is 15 minutes)
📥 STEP: Topological grouping
🚀 Action Click Topological grouping.
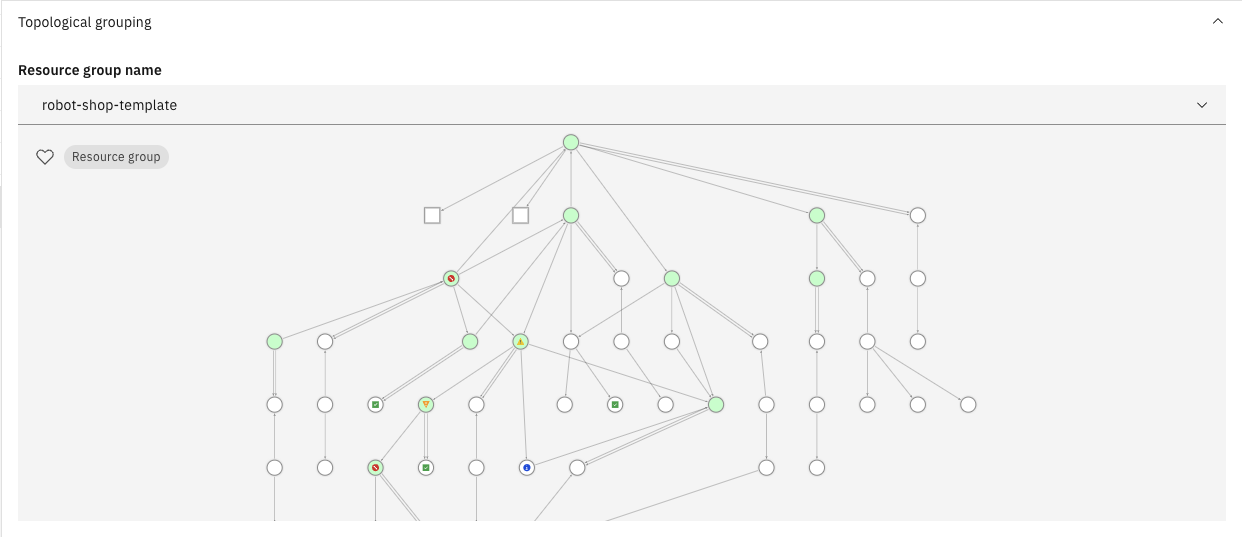
📣 Narration
Other alerts were grouped because they occurred on the logically or physically related resources. This correlation is using the application topology service that stitches topology information from different sources.
📥 STEP: Temporal grouping
🚀 Action Click Temporal correlation.
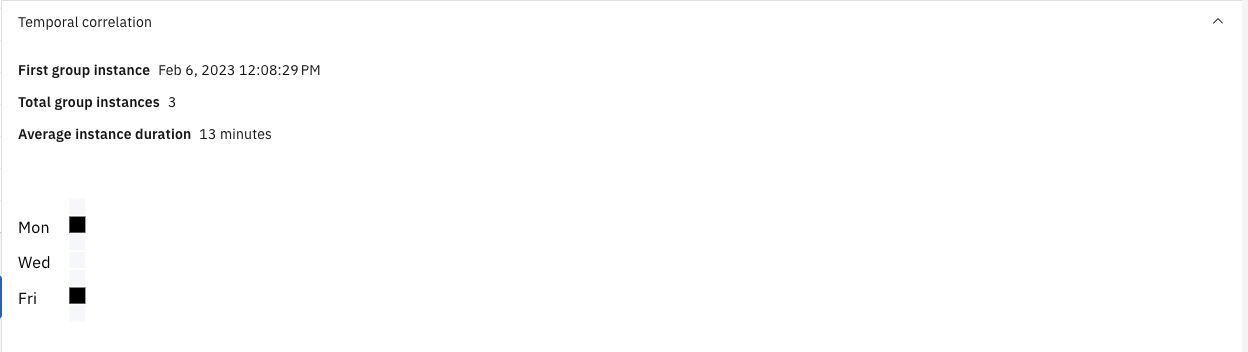
📣 Narration
Finally, the temporal correlation adds to the story events that previously, in history, are known to occur close to each other in the short time window. What is most important here is the fact that all these correlations happen automatically – there is no need to define any rules or program anything. In highly dynamic and distributed cloud-native applications this is a huge advantage that saves a lot of time and effort.
🚀 Action Close the Alert details window.