Lab 6: Telemetry data
Challenges with microservices
We all know that microservice architecture is the perfect fit for cloud native applications and it increases the delivery velocities greatly. Envision you have many microservices that are delivered by multiple teams, how do you observe the the overall platform and each of the service to find out exactly what is going on with each of the services? When something goes wrong, how do you know which service or which communication among the few services are causing the problem?
Istio telemetry
Istio’s tracing and metrics features are designed to provide broad and granular insight into the health of all services. Istio’s role as a service mesh makes it the ideal data source for observability information, particularly in a microservices environment. As requests pass through multiple services, identifying performance bottlenecks becomes increasingly difficult using traditional debugging techniques. Distributed tracing provides a holistic view of requests transiting through multiple services, allowing for immediate identification of latency issues. With Istio, distributed tracing comes by default. This will expose latency, retry, and failure information for each hop in a request.
You can read more about how Istio mixer enables telemetry reporting.
Collect metrics and logs using Prometheus and Grafana
This step shows you how to configure Istio Mixer to gather telemetry for services in your cluster.
-
Open the Grafana Dashboard
istioctl dashboard grafana > /dev/null &``
Just hit enter a few times to get back the prompt if neeed.
-
Click on the
Homebutton in the upper left hand corner -
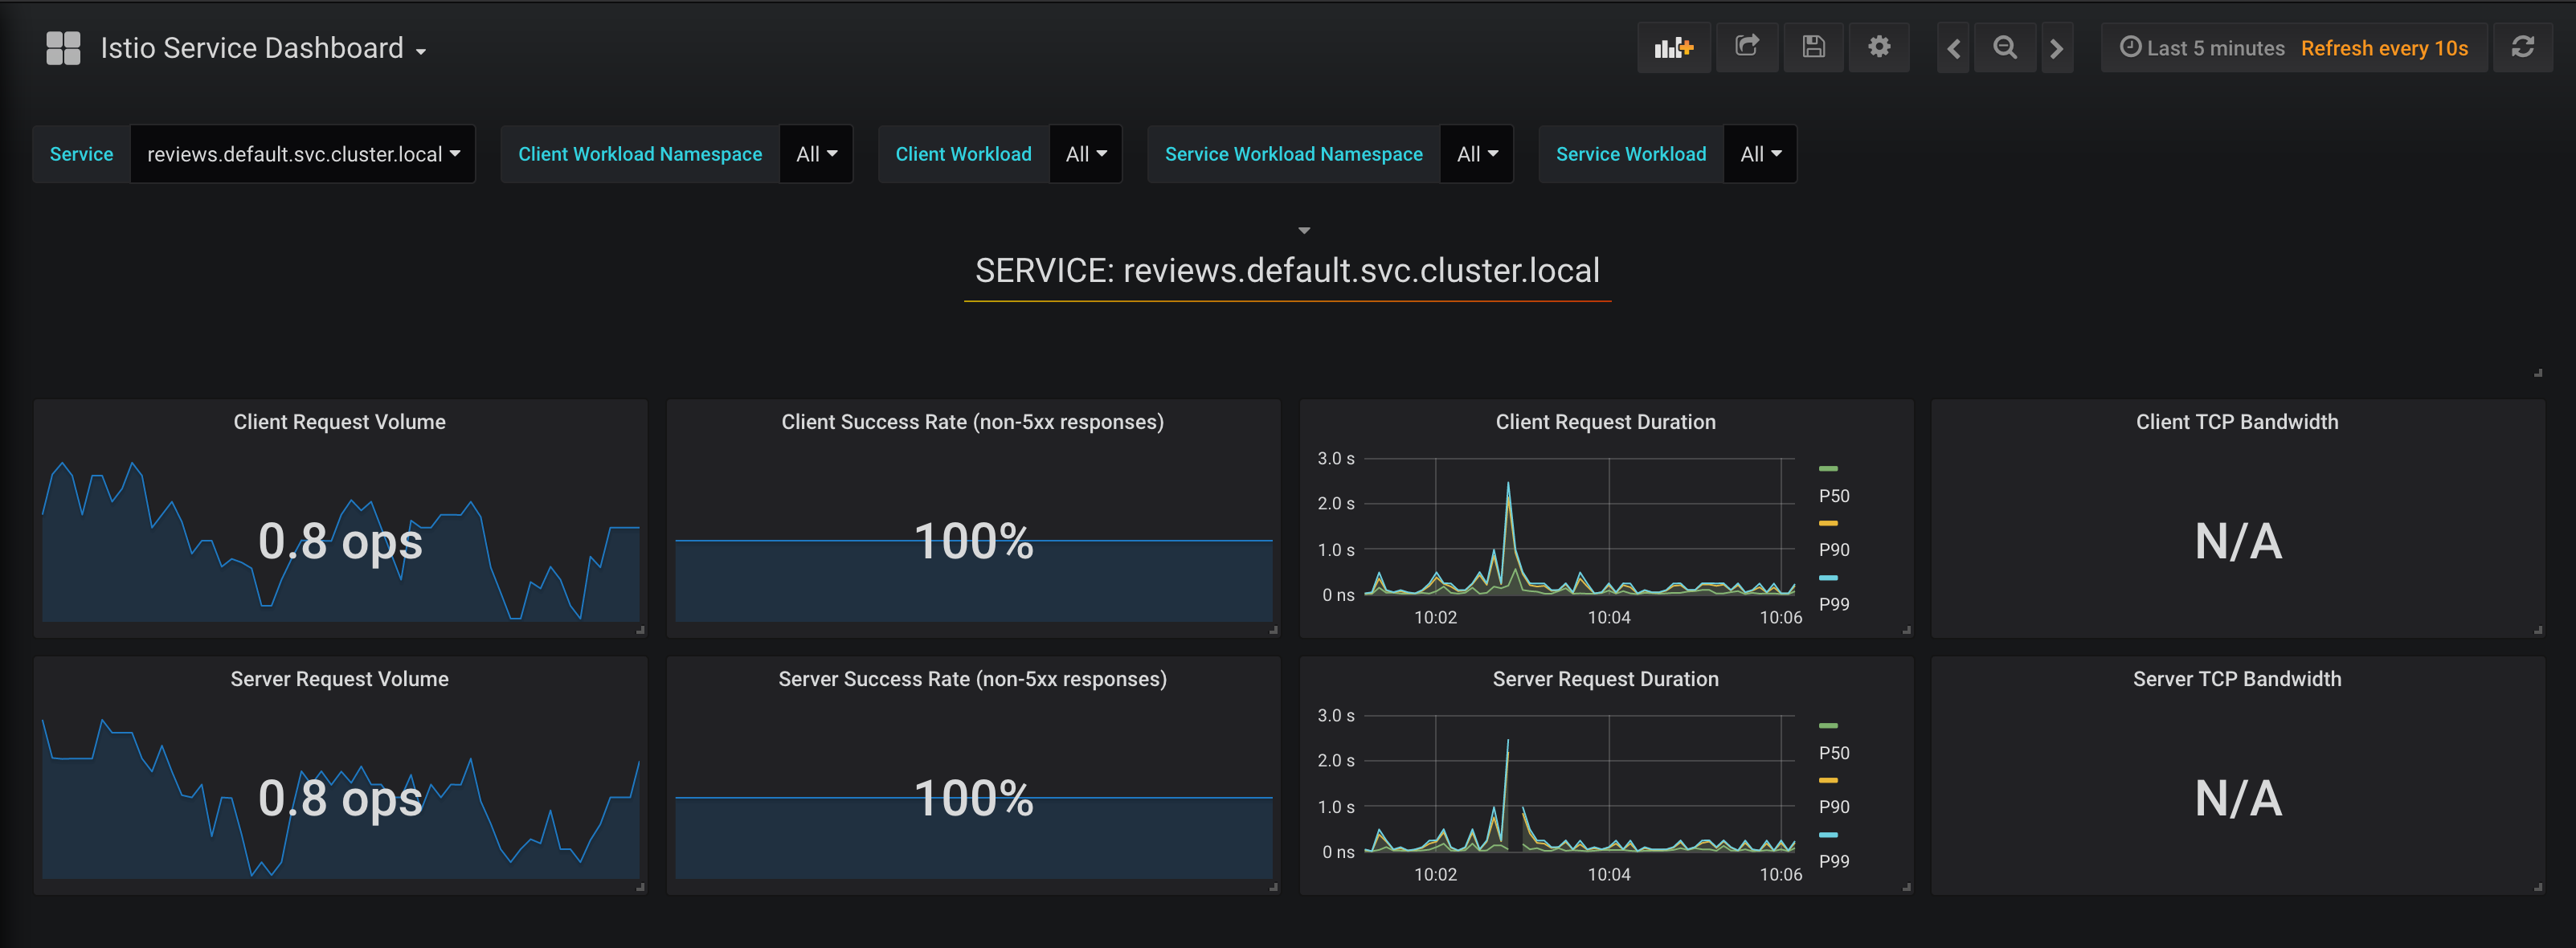
Select
Istio Service Dashboard
Your dashboard should look like this:

Play around and observe the different metrics being collected.
Collect request traces using Jaeger
Jaeger is a distributed tracing tool that is available with Istio.
- Access the Jaeger Dashboard
```bash
istioctl dashboard jaeger > /dev/null &
```

> Just hit enter a few times to get back the prompt if neeed.
>
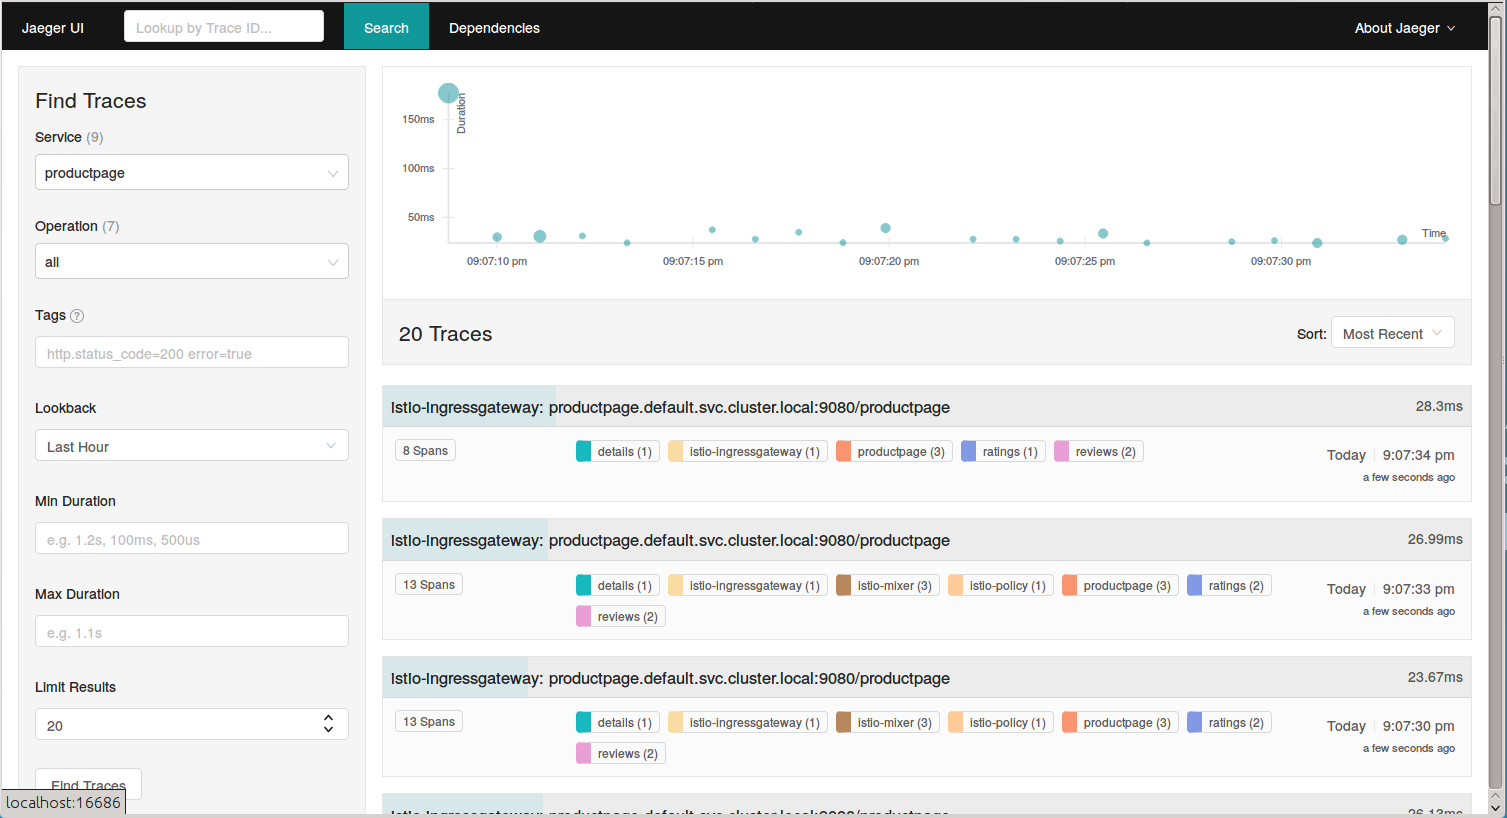
- Select
productpage.defaultin the left handServicedropdown - Click
Find Traces
Your dashboard should look something like this:

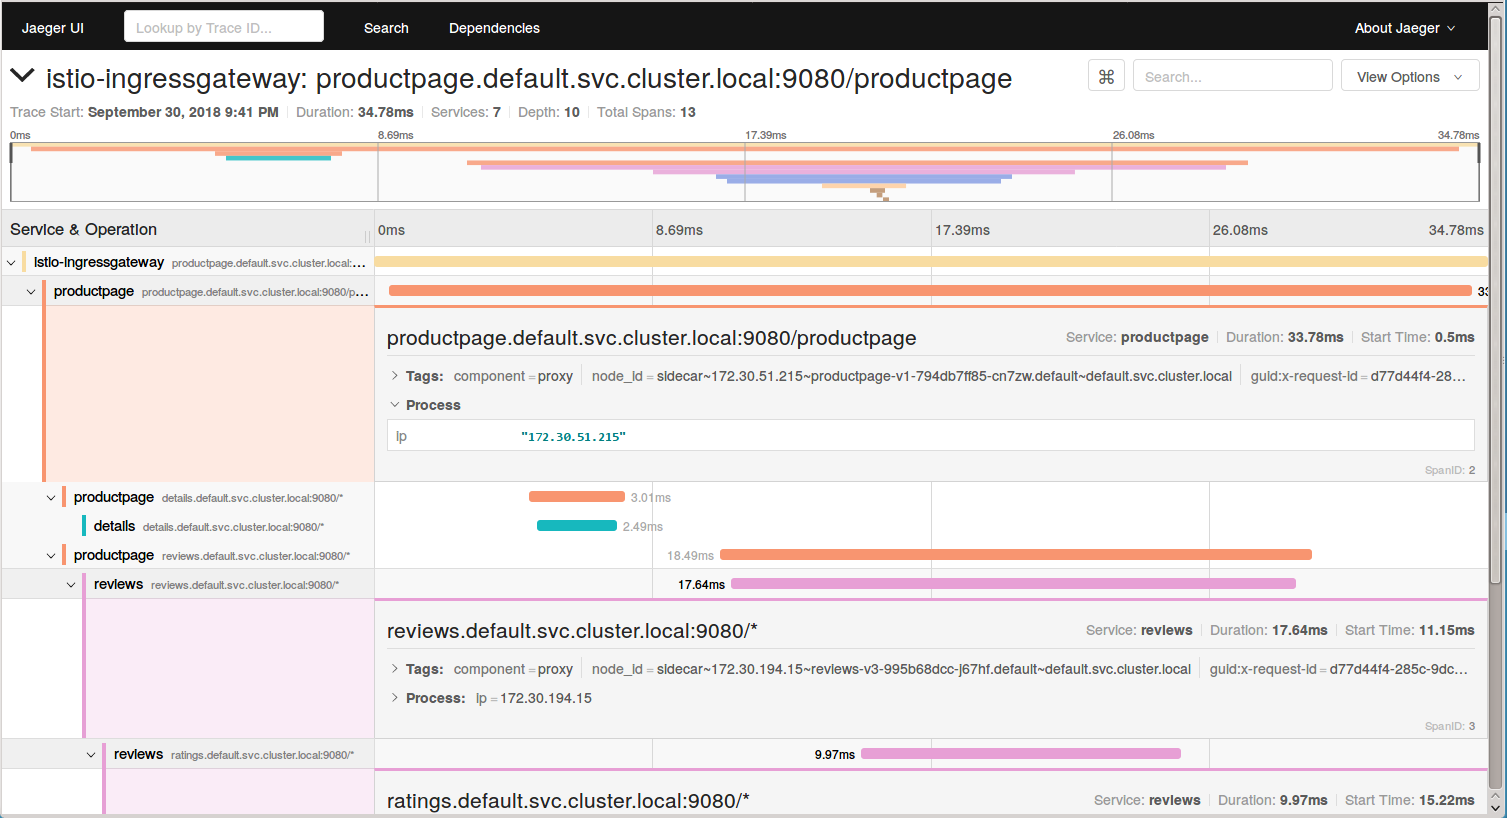
- Click on one of those traces and you will see the details of the traffic you sent to your BookInfo App. It shows how much time it took for the request on
productpageto finish. It also shows how much time it took for the requests on thedetails,reviews, andratingsservices.
