Lab 4: Monitoring with Kiali
Kiali is an open-source project that installs on top of Istio to visualize your service mesh. It provides deeper insight into how your microservices interact with one another, and provides features such as circuit breakers and request rates for your services
-
In order to create some more sustained traffic, execute the following command:
kubectl apply -f ~/training/istio/createTraffic.yaml``
This starts a Pod that makes requests to the productpage.
-
You can open Kiali with
istioctl dashboard kiali > /dev/null &``
Just hit enter a few times to get back the prompt if neeed.
The login is:
User: admin
Password: admin
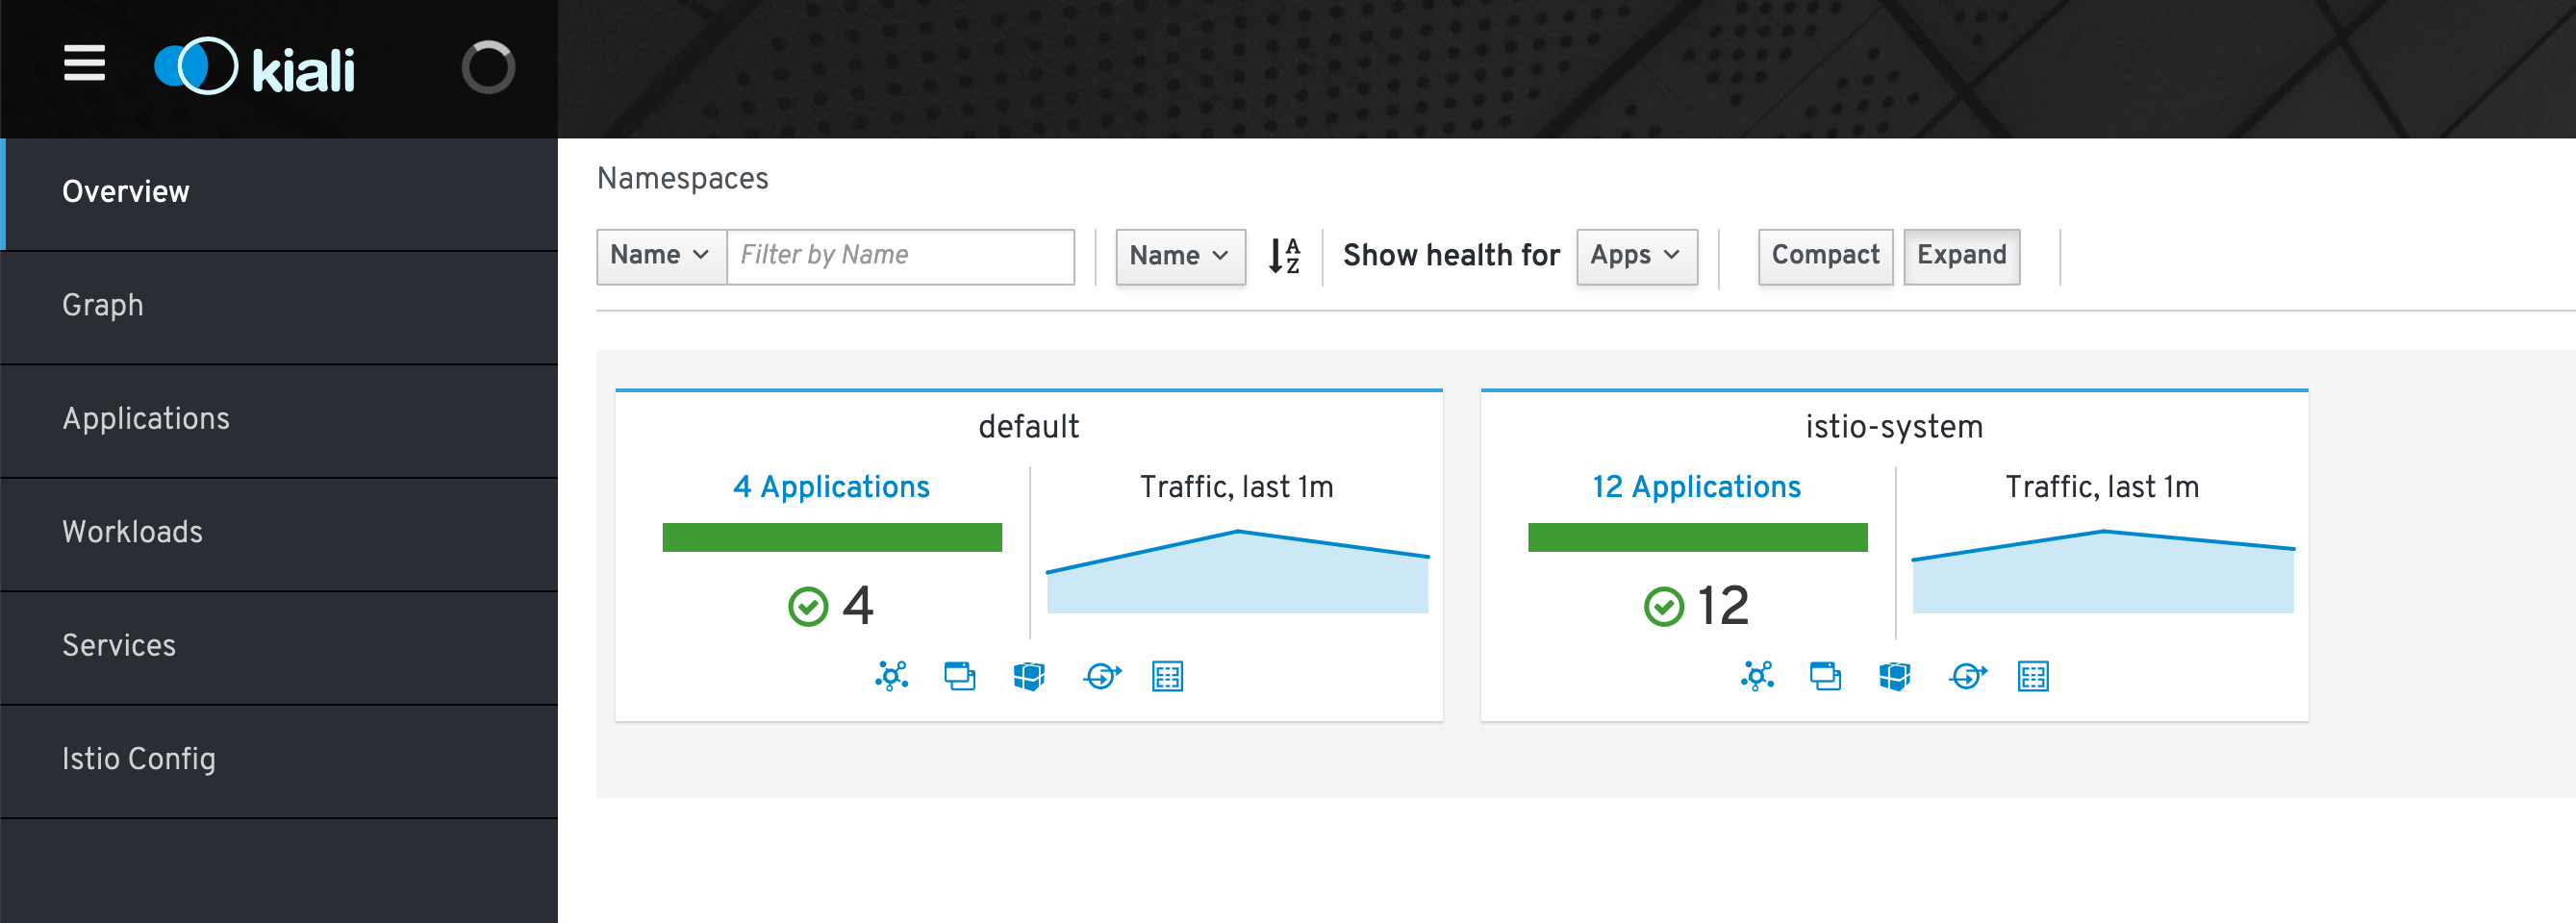
And you should now see the Dashboard

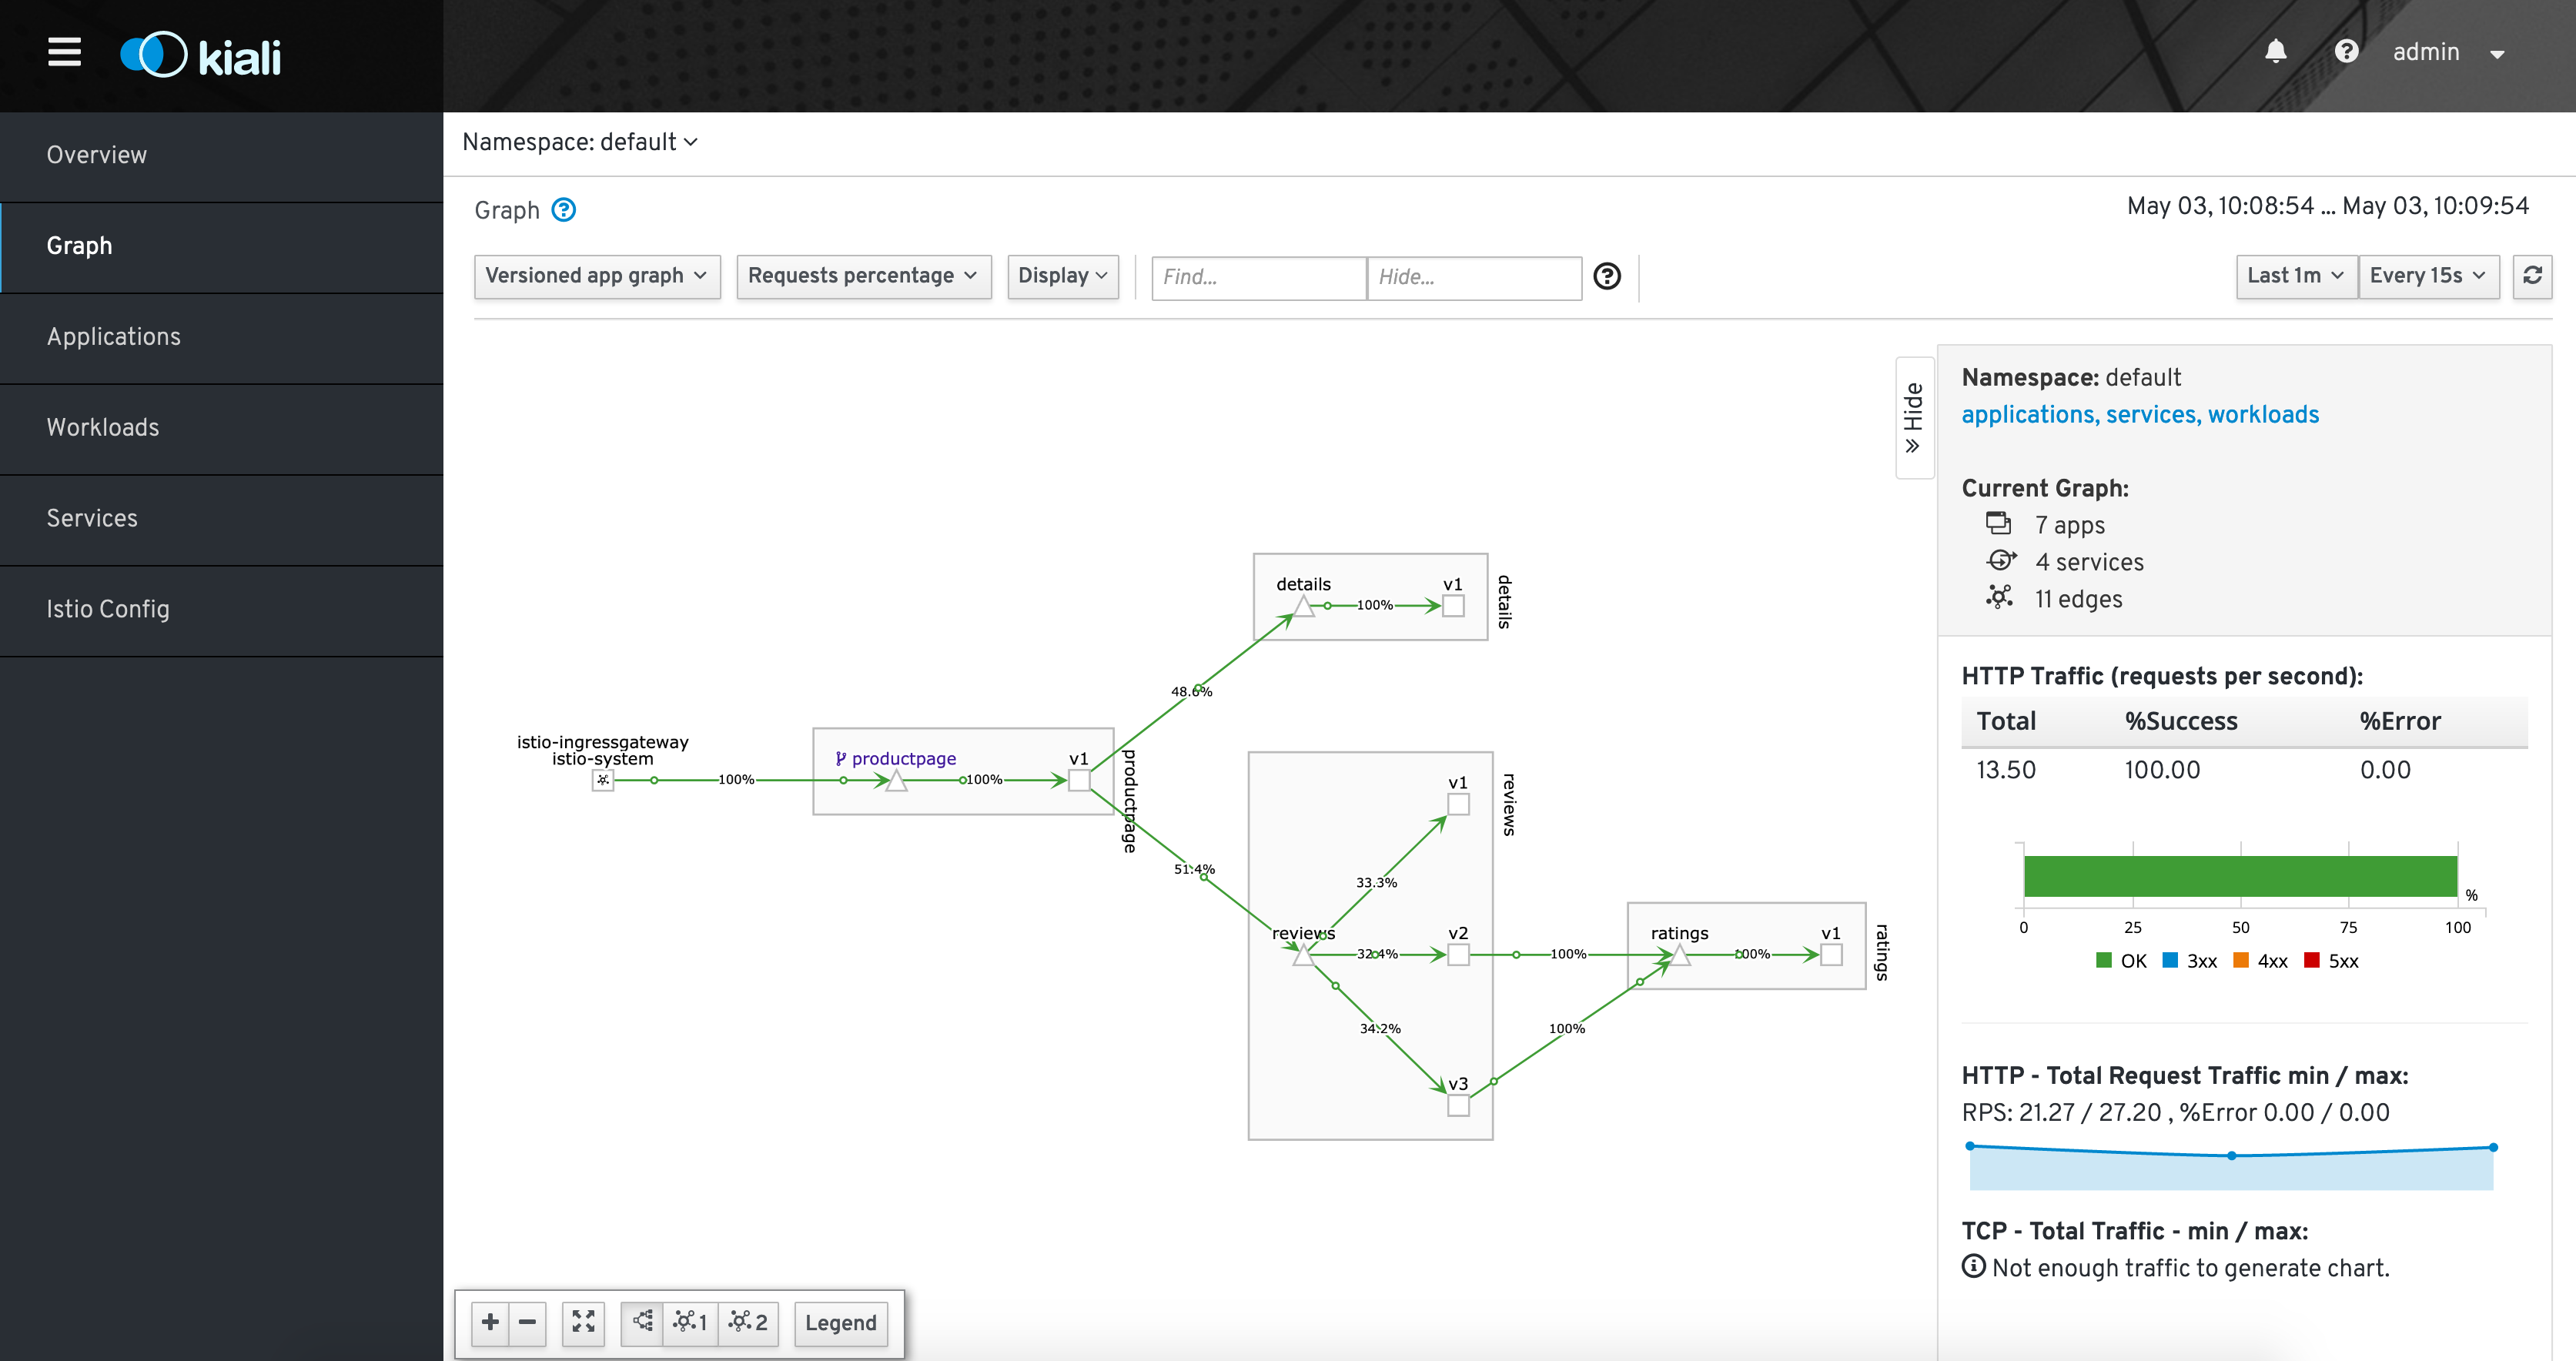
- Select
Graphin the left hand menu. - Then select
defaultfrom the Namespaces drop-down menu - Make sure that you select
Versoned App Graphfrom the second drop-down menu - Select
Requests PercentageandTraffic Animationfrom the `Display drop-down menu - And make sure that you check all types from the
Displaydrop-down menu - If you see no objects, there might be no traffic flowing through your mesh network yet (you chan change the seeting to display inactive objects too)
- You might want to change the refresh rate to 10s to more easily observe the changes in traffic
You can then observe traffic flowing through your mesh network.

Get more info on the Kiali website.